Jovo debugger vs web returning different outputs


#1

Hi, our primary reason for Jovo is to support Alexa, Google Assistant & web chatbot using the same app.

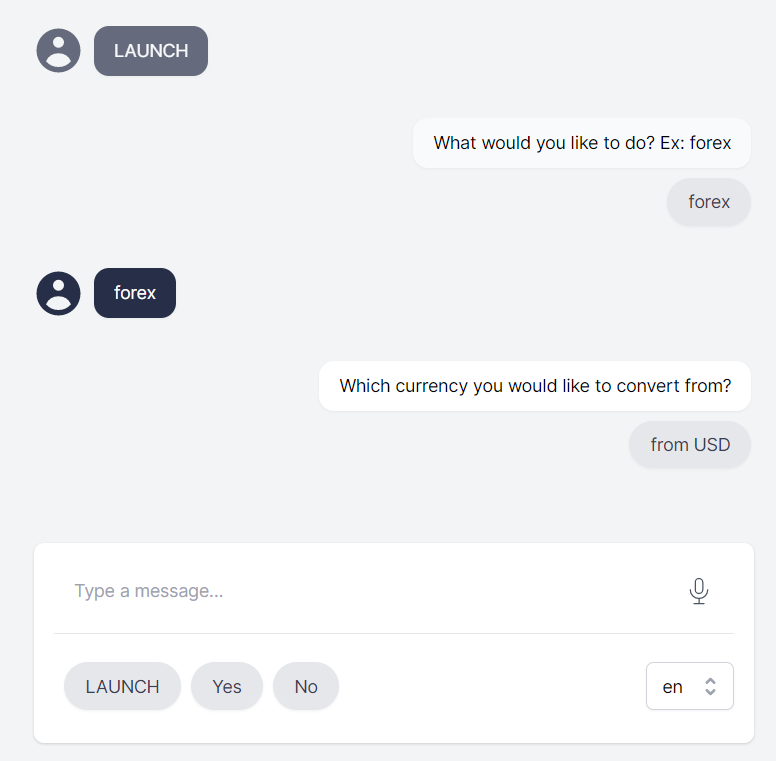
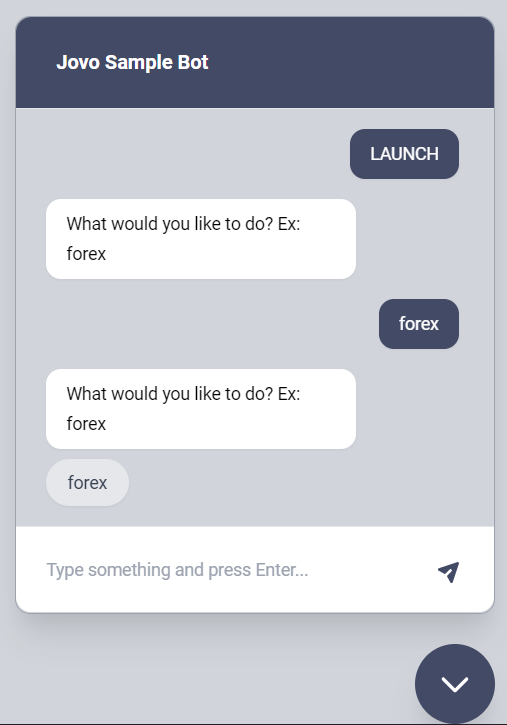
I developed a sample app to test Alexa & Web chatbot but seeing different behaviors. Jovo debugger is behaving as expected, but Web is not which is repeating the same prompt again and again.

Request/response trace for both channels: https://www.diffchecker.com/RKAncI47, which are almost identical.

Below is the screenshot of the conversation.

Test component:

import { Component, BaseComponent, Intents } from '@jovotech/framework';

@Component()
export class GetSlots extends BaseComponent {
  START() {
    if (!this.$session.data.ccyFrom) {
      this.$send({message: 'Which currency you would like to convert from?', quickReplies: ['from USD']});
    } else if (!this.$session.data.ccyTo) {
      this.$send({message: 'To which currency you would like to convert?', quickReplies: ['to INR']});
    }
    return;
  }
  
  @Intents(['GetFromCcy'])
  GetFromCcy() {
    const ccyFrom = this.$entities.ccy?.value;
    this.$resolve('ccyFrom', ccyFrom);
  }
  
  @Intents(['GetToCcy'])
  GetToCcy() {
    const ccyTo = this.$entities.ccy?.value;
    this.$resolve('ccyTo', ccyTo);
  }
}

@Component({
  components: [GetSlots]
})
export class TestForexComponent extends BaseComponent {
  START() {
    return this.$send({message: 'What would you like to do? Ex: forex', quickReplies: ['forex']});
  }
  
  @Intents(['GetForexRate'])
  GetForexRate() {
    return this.$delegate(GetSlots, {
      resolve: {
        ccyFrom: this.onCcyFrom,
        ccyTo: this.onCcyTo
      }
    });
  }
  
  onCcyFrom(ccyFrom: string) {
    this.$session.data.ccyFrom = ccyFrom;
    this.GetForexRate();
  }
  
  onCcyTo(ccyTo: string) {
    this.$session.data.ccyTo = ccyTo;
    const ccyFrom = this.$session.data.ccyFrom;
    this.$send(`1 ${ccyFrom} is equal to 76 ${ccyTo}`);
  }
  
  UNHANDLED() {
    return this.START();
  }
}


What could be the issue? Thanks


#2

Seems like in the web client, “forex” goes into UNHANDLED.

Could you share a little bit about your setup?

  • Which NLU do you use? Do you use the same NLU for both the Web platform and the Debugger?
  • Can you share the $input object for the last request for both the Debugger and the Web platform?

#3

Which NLU do you use? Do you use the same NLU for both the Web platform and the Debugger?

Do I need to configure NLU for the web platform explicitly? I thought NLP.js is default one, isn’t it?

app.ts:

  plugins: [
    new AlexaPlatform(),
    new WebPlatform(),
  ],
  • Can you share the $input object for the last request for both the Debugger and the Web platform?

Jovo Debugger shows the RIDR lifecycle in the right side column. But not sure how to get this for the web platform. Please guide.


#4

Yes, you need to add an NLU plugin to the web platform.

Edit: Here is a sample: https://github.com/jovotech/jovo-starter-web-chatwidget/blob/master/app/src/app.ts

If you’re using the Jovo Webhook as an endpoint in your web client and keep the Debugger window open, you can see the web client requests there as well


#5

Yes, you need to add an NLU plugin to the web platform.

I got it web platform working by adding the NLP NLU. Thanks a ton. Better to add this in the web platform documentation.

If you’re using the Jovo Webhook as an endpoint in your web client and keep the Debugger window open, you can see the web client requests there as well

Do you mean the browser Devtools or Jovo Debugger window?


#6

Would appreciate a PR if you want to add some learnings: https://github.com/jovotech/jovo-framework/blob/v4/latest/platforms/platform-web/docs/README.md Thank you!

The Jovo Debugger


#7

Woww, very nice DX. I’m able to see the web platform RIDR log in the Jovo Debugger.

Created this PR for doc update: https://github.com/jovotech/jovo-framework/pull/1202. Please let me know if something to be corrected.


#8

Hehe, great to hear that! I think this is a feature that we could make a bit more popular :thinking: any ideas?

Thank you! Just merged it: https://www.jovo.tech/marketplace/platform-web


#9

Hehe, great to hear that! I think this is a feature that we could make a bit more popular :thinking: any ideas?

Maybe this feature can be mentioned in the Jovo Debugger just like how it is currently showing Jovo 4 launch banner.

Also, saving the history of the previous interaction could be way useful for debugging. For example, I had a bug in 4th RIDR cycle (ex: LAUNCH > intent_1 > intent_2 > intent_3). Now I need to follow all these intents everytime in order to see the RIDR of 4th intent which is very time-consuming. As we all knew, most of the times we need to fiddle multiple times to spot the issue.


#10

Ah yes, this makes sense. Did you see the ability to add sequence buttons to the Debugger? https://www.jovo.tech/docs/debugger-config#sequences


#11

Yes, I did. Thanks